The ZTEST function calculates one-tailed probability of z-test statistical concept. This is an older function and maybe retired in the next Excel version. The new function is Z.TEST.
Interpreting the result of the ZTEST function in Excel involves understanding the P-value it returns as well as null hypothesis and alternative hypothesis.
- P-value: The probability that the observed sample mean would occur if the null hypothesis were true. It helps you determine the significance of your results.
- Null Hypothesis (denoted as H0): is a fundamental concept in statistics used for hypothesis testing. It represents a statement of no effect or no difference, and it serves as the default or starting assumption that there is no relationship between two measured phenomena or no association among groups. The probability that the observed sample mean would occur if the null hypothesis were true. It helps you determine the significance of your results.
- Alternative Hypothesis (denoted as H1 or Ha) is a statement that contradicts the null hypothesis. It represents the outcome you expect or hope to find in your study or experiment. Essentially, it suggests that there is a significant effect or difference.
Syntax
The syntax of the ZTEST function is as follows:
ZTEST(array, x, [sigma])Where:
– array: The range of data or array that contains the sample.
– x: The mean of the population to test against.
– sigma (optional): The population standard deviation. If omitted, it uses the sample standard deviation.
Examples
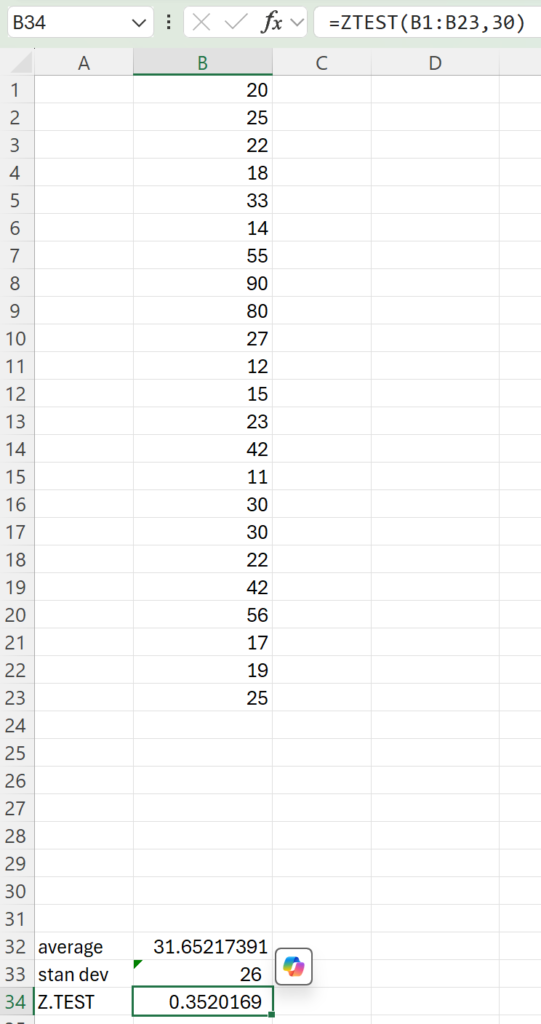
Assuming you have a data set of ages of people in a chess club in cells B1:B23 and you want to test whether your chess club’s average age significantly differs from the average age of total population in your city, which is 30, the formula would be:
=Z.TEST(B1:B23, 30)This will return the one-tailed p-value for your data range compared to the value 50, which is 0.911. In other words, this means that your average age in a chess club is not significantly different than the average age in your city.

Example 2: Including Population Standard Deviation
In this example, let’s say the population standard deviation is known and equals 15. You can include this value in your calculation:
=ZTEST(B1:B23, 30, 26)The result will be 0.38
Error Handling
When using the ZTEST function, you might encounter the following errors:
– N/A: This indicates that there is insufficient data in the specified array.
– VALUE!: This error occurs if the provided arguments are of the wrong type.
Ensure your data is numeric and appropriately arranged to avoid these issues.
Conclusion
The ZTEST function is a powerful tool for statisticians and data analysts. It streamlines hypothesis testing by providing a means to evaluate how a sample compares to a population mean. By understanding and utilizing this function, users can make more informed decisions based on statistical evidence.
