In the previous post I explained how to create Calculated Groups (Calculated Groups – comparisons and calculated columns in a pivot directed by slicers » Data Empower), here I will talk about how to create different formatting for the calculated items.
For those of you created Calculated Groups in PowerBI using Tabular Editor (Tabular Editor), there are situations where some of the items need to have different formatting. For example YoY% need to have a percentage sign, revenue may need a “K” sign for thousands as well as “$” sign in front.
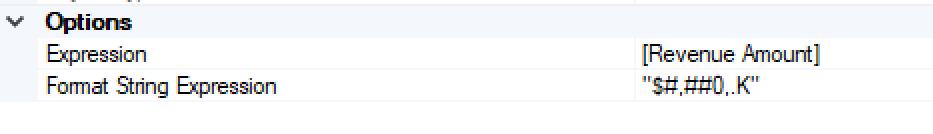
To achive that there is a convenient option in Tabular Editor, under Options -> Format String Expression. For each Calculated item, it is possible to insert a different format.
For example for Revenue Amount, if we want to express something like $23.5K, then the Format String would be “$#,##0,.K”
Below is the list of some common formatting options that can you have. Its a bit different from Excel, so wacht out.
| Type | Code | Example |
| 0 Decimals with thousands separator | “#,##0.” | 524,456 |
| 2 Decimals with thousands separator | “#,##0.00” | 524,456.00 |
| $ Sign with K for thousands | “$#,##0,.K” | $5,245K |
| millions with separator | “#,##0,,.M” | 5M |
| Percentage with 2 decimals | “0.00%” | 5.25% |
| Percentage with 0 decimals | “0%” | 5% |
For more complete list of Tabular Editor formatting refer to my other blog here.
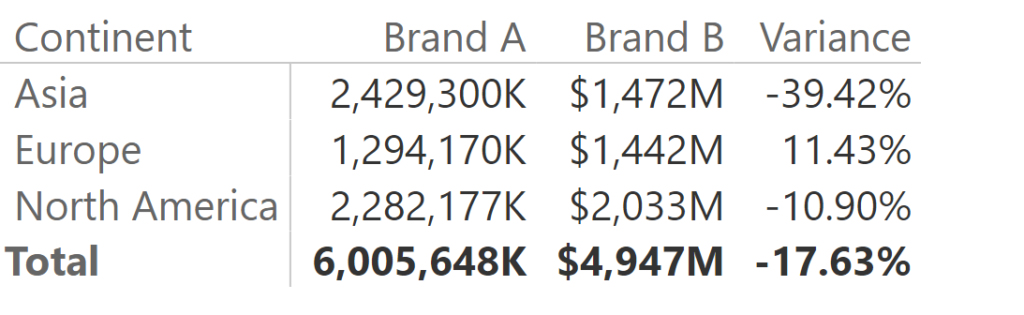
As an example, here is a screenshot how different Calculated Items have been formatted in the same measure (Sales Amount).
There is also a way to do dynamic formatting for currency types depending on the sales location, but this is rather a rare (and complex) occasion and will not be explained here.
You can check out my step-by-step video on Calculated Groups and formatting here: Power BI: Calculated Groups and Formatting using Tabular Editor (ganjing.com)
Please help me to the following odd string format behaviours I have experienced:
I have implemented a dynamic string format in Tabular Editor 3 for the below area chart, and it works as expected (see below screenshots). However, the COUNT cards behave in the same fashion, i.e. when the selection is in the format of %, the count also displays % and when the selection is in decimal, the count displays decimal. Note the count is defaulted to whole number.
I also tried to string formated the count cards to “0.”, with no desired outcome.
(sorry the images can’t be copied to here)
Please help!
Chao-Yin
Sorry, without images I cannot figure out what is exactly not working.