
The Z.TEST function is a powerful feature in Excel that helps users conduct hypothesis testing for a sample mean compared to a known population mean. It calculates the one-tailed P-value of a z-test, which helps determine if there is a significant difference between the sample mean and a hypothesized population mean. In other words, you can use Z.TEST to check if the average of a small sample differs greatly from the average of total population.
Syntax
The syntax of the Z.TEST function is as follows:
Z.TEST(array, x, sigma)Where:
– array: This is the array or range of data that you want to evaluate.
– x: This is the value against which you want to test the mean.
– sigma: (Optional) This is the known population standard deviation. If omitted, Excel will calculate the sample standard deviation.
Definitions
- P-value: The probability that the observed sample mean would occur if the null hypothesis were true. It helps you determine the significance of your results.
- Null Hypothesis (denoted as H0): is a fundamental concept in statistics used for hypothesis testing. It represents a statement of no effect or no difference, and it serves as the default or starting assumption that there is no relationship between two measured phenomena or no association among groups. The probability that the observed sample mean would occur if the null hypothesis were true. It helps you determine the significance of your results.
- Alternative Hypothesis (denoted as H1 or Ha) is a statement that contradicts the null hypothesis. It represents the outcome you expect or hope to find in your study or experiment. Essentially, it suggests that there is a significant effect or difference.
Interpretation of results
A small p-value (<= 0.05) indicates that your sample mean is significantly different from the hypothesized population mean. On the other hand, a large p-value implies there isn’t sufficient evidence to conclude a difference between them.
Examples
Example 1: Basic Usage
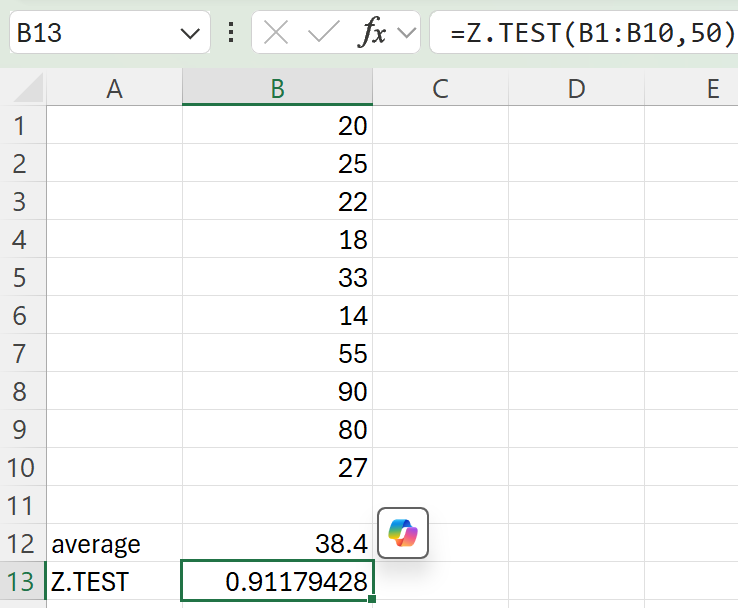
Assuming you have a data set of ages of people in a chess club in cells B1:B10 and you want to test whether your chess club’s average age significantly differs from the average age of total population in your city, which is 50, the formula would be:
=Z.TEST(B1:B10, 50)This will return the one-tailed p-value for your data range compared to the value 50, which is 0.911. In other words, this means that your average age in a chess club is not significantly different than the average age in your city.
Example 2: Including Population Standard Deviation
If you have the same data set in B1:B10 and you know the population standard deviation is 26, the function would look like this:
=Z.TEST(B1:B10, 50, 26)This variation will determine the p-value of 0.92, incorporating the known standard deviation into the analysis.
Error Handling
The Z.TEST function can return errors under certain conditions:
– If the array argument is empty, the function will return a NUM! error.
– If the x value is not a number, or if provided data ranges do not match, it may return a VALUE! error.
To avoid these errors, ensure that the data ranges are valid and that all input parameters are correctly formatted.
Conclusion
The Z.TEST function is an essential tool for those needing to conduct statistical analyses using Excel. By calculating the likelihood of observing a sample mean relative to a known population mean, users can make informed decisions based on their data.